IMPULSE SCANNER
SCANNER GUIDE
Crypto futures heatmap: reading price moves across markets
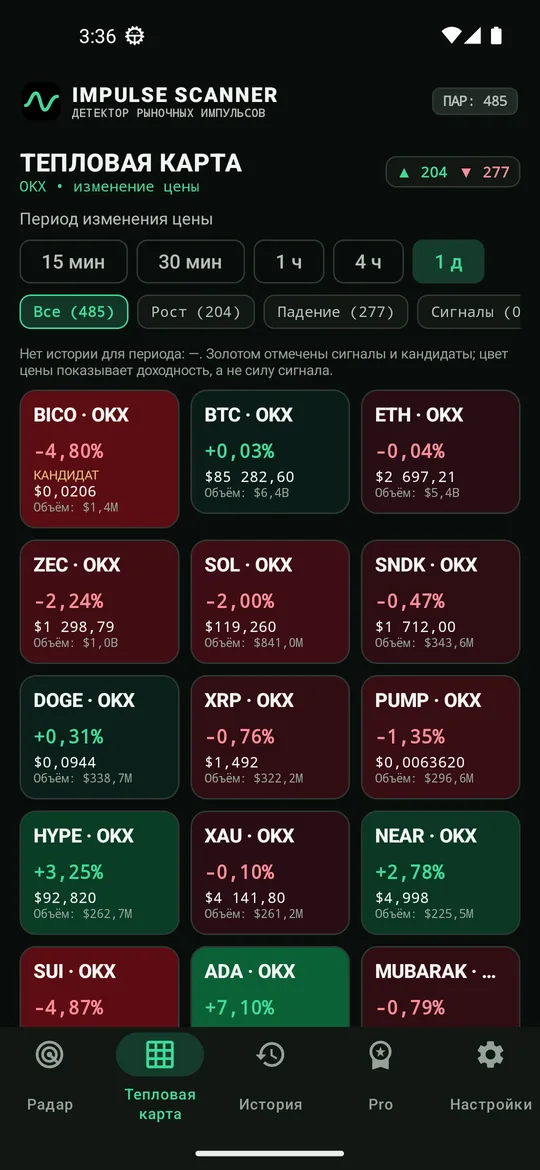
A heatmap puts many markets’ price changes on one screen. Use it to locate movement and choose a pair for closer inspection.
Impulse Scanner team · Updated 22 October 2026
Reading colours and labels
Green represents a positive price change over the selected window; red represents a negative change. Labels identify the pair and its change. Scroll through larger market sets instead of treating tiny unreadable cells as useful information.
A market can be green over 24 hours and red over 15 minutes. Compare cells on the same window and remember that the web version uses completed candles.
Not a liquidation or market-cap map
This is a futures price-change heatmap. It does not display market capitalisation, stop clusters, forced liquidation prices or order-book liquidity.
The proportion of green cells is not the share of capital flowing into purchases. Exchange, turnover, coverage, search and favourites determine which markets are visible.
Using the browser heatmap
- Open the free scanner and wait for candle history.
- Select an exchange, movement window and turnover coverage in Settings. On mobile the Settings button is next to Pause.
- Open the Heatmap tab and check the selected sort order.
- Search for part of a symbol or use favourites to narrow the view.
- Tap a cell to open its chart, then compare price, volume and the Impulses tab.
Heatmap versus detector
The map includes price changes that have not passed the detector’s price, volume and confirmation requirements. A red cell is not an instruction to short; a green cell is not an instruction to buy.
Check coverage and freshness first. If an exchange is unavailable, the visible picture describes only the data received, not the entire crypto market.